Science explained · Space
How Do the Northern Lights Glow?
Why does oxygen glow green at one height and red higher up—and why can a camera see colors your eyes miss?
Explore the sections in this article
The solar wind supplies a disturbance, not a bucket of colored light
The Sun continuously releases plasma—electrons and ions carrying an embedded magnetic field. Speed, density and field orientation vary. Coronal mass ejections and fast streams can disturb near-Earth space, but an eruption aimed elsewhere may have little terrestrial effect.
Earth’s magnetic field creates a magnetosphere that deflects much of the solar wind. This shield is not solid. Energy and momentum cross its boundary through plasma processes, especially magnetic reconnection when field configurations favor it. The dayside field can reconnect with the interplanetary magnetic field; the nightside tail stores and releases energy.
Many auroral electrons were already in geospace rather than traveling straight from the solar surface to an observer. Electric fields and plasma waves accelerate or scatter them into the atmosphere. “Particles from the Sun make aurora” is useful ancestry, not a literal path for every glowing collision.
Magnetic field lines guide motion without acting like rails
A charged particle in a magnetic field experiences a force perpendicular to its motion and the field. It spirals around a field line while moving along it. Electric fields, gradients and changing geometry add drifts and acceleration.
Near the polar regions, field lines connect the magnetosphere to the ionosphere. Particle precipitation forms auroral ovals centered on magnetic rather than geographic poles. The ovals move and expand as magnetospheric conditions change. During strong geomagnetic activity, visible aurora can extend to lower magnetic latitudes.
A classroom drawing of two fixed rings hides local time and dynamics. Nightside substorms can brighten and expand an arc rapidly. Dayside cusp aurora has different access and drivers. Northern and southern displays are related through the field but not guaranteed mirror images because field orientation, season and atmosphere differ.
One collision changes an atom’s allowed state
An energetic electron can transfer energy to an atmospheric atom or molecule. Bound electrons within that species move into an excited configuration. Quantum mechanics permits particular energy states, not every intermediate value. When the system relaxes, the energy difference may leave as a photon.
It may also be lost without visible light. A collision with another particle can quench the excited state, transferring energy into motion or other internal states. The balance between radiative emission and collisional quenching changes sharply with altitude because atmospheric density falls.
This is why a neon-sign analogy helps only partly. Both involve excited gas and characteristic emission, but an aurora is a low-density, chemically mixed, magnetically driven natural plasma spread across hundreds of kilometers.
Green oxygen needs a particular compromise
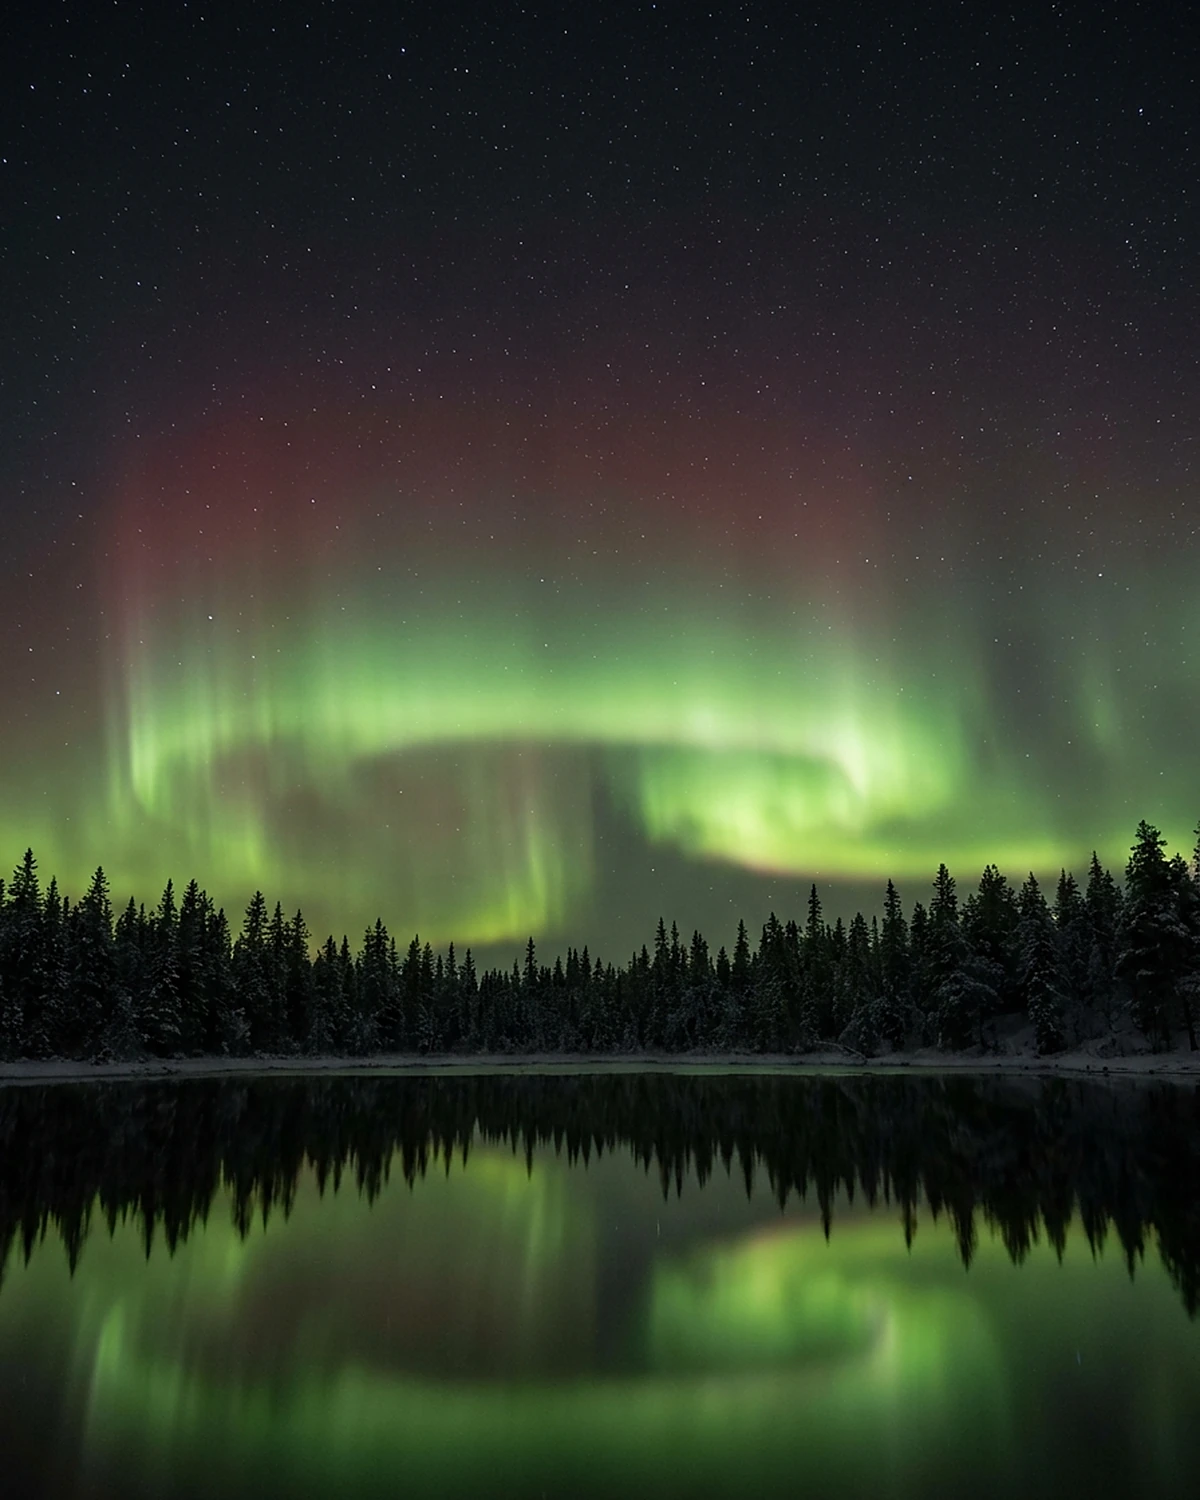
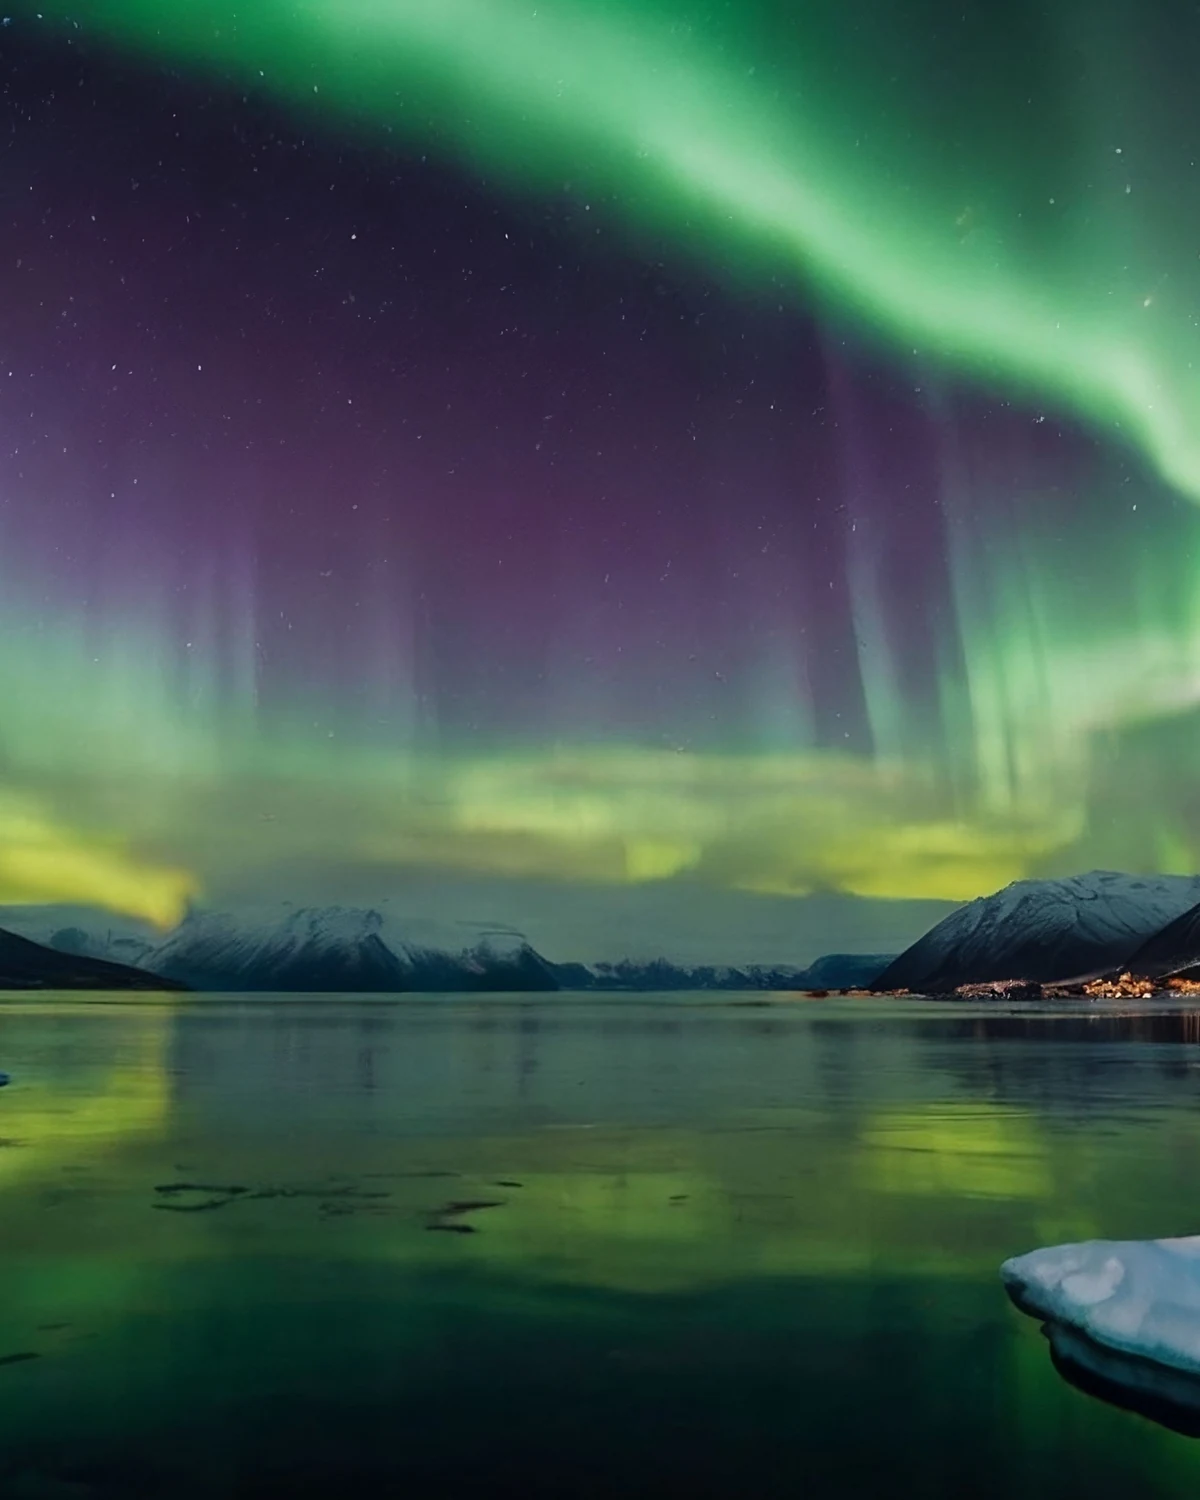
The familiar green line is atomic oxygen emission near 557.7 nanometres. It is common around roughly 100–200 kilometers, with the strongest altitude depending on precipitation and atmosphere. Below that region, collisions are frequent enough to quench the relevant excited state before it emits efficiently. Much higher, energetic deposition and oxygen density differ.
Atomic oxygen also produces red emission near 630.0 nanometres from a longer-lived excited state. Because that state can wait much longer before emitting, it is readily quenched in dense lower air; red oxygen therefore favors higher altitudes, often above about 200 kilometers. Diffuse red aurora can be faint to human eyes.
Nitrogen molecules and molecular ions contribute blue, violet, pink and red features, especially where more energetic precipitation reaches denser lower atmosphere. Mixed emissions and human vision create colors that do not map one-to-one onto a single species.
A quantitative anchor: the energy of one green photon
Photon energy is E = hc/λ. Using Planck’s constant 6.626 × 10^-34 J·s, light speed 3.00 × 10^8 m/s, and wavelength 557.7 × 10^-9 m:
E ≈ (6.626 × 10^-34 × 3.00 × 10^8) ÷ (557.7 × 10^-9) E ≈ 3.56 × 10^-19 joule, or about 2.22 electronvolts.
That is the emitted photon’s energy, not the precipitating electron’s total energy. One incoming electron may undergo many interactions, ionize molecules, create secondary electrons or deposit heat. Brightness depends on particle flux and the number of emissions along a viewing path, not one collision.
Altitude is also a clock
The green oxygen state has a radiative lifetime on the order of a second; the red oxygen state can persist far longer, roughly tens to more than a hundred seconds depending on transition description. During that wait, another collision may remove the excitation. At lower altitude, short mean free paths make such collisions likely.
An atom also moves while excited. Long-lived red emission can be displaced from the exact place where energy first arrived. Wind and diffusion matter. A photograph is therefore a time-integrated projection of a three-dimensional, moving emission volume—not a sheet hanging at one distance.
The lower edge of an auroral curtain can appear sharper because more energetic electrons penetrate deeper before losing energy. Inferring exact electron energy from color alone is unsafe; scientists use calibrated multi-wavelength imagers, spectra, radar and models.
Why the curtain folds
Auroral arcs align with magnetic structure and field-aligned currents connecting magnetosphere and ionosphere. Narrow regions of particle acceleration and conductivity produce luminous sheets. Seen edge-on, a thin sheet looks bright; folds and rays trace changing magnetic geometry and perspective.
The lower atmosphere is not blowing these curtains like fabric. Auroras occur far above ordinary weather. Their rapid motion reflects changing electric fields, currents and precipitation patterns, though neutral winds in the thermosphere can influence the coupled system.
Parallel rays can seem to converge overhead for the same perspective reason railway tracks converge in the distance. A corona-like burst around the magnetic zenith is geometry, not a funnel touching the observer.
The human eye and camera perform different experiments
At low light, rod cells dominate human vision. Rods are sensitive but do not provide normal color discrimination. Faint aurora may appear gray-white or pale green even when a camera records saturated green, red and purple.
A camera can hold its shutter open, gathering photons for seconds. It may use a sensor with different spectral response, high gain, noise reduction and color processing. Long exposure also smears motion and can turn separate rays into a smooth ribbon. A photograph is not necessarily fake, but it is not the same temporal and sensory measurement as direct vision.
Bright aurora can stimulate cones and look vividly colored. Dark adaptation, age, local lighting and individual vision change perception. A photograph you find online is not a promise about what your own eyes would have seen from the same spot on the same night.
Forecasting begins upstream and grows uncertain downstream
Space-weather forecasters observe the Sun, solar wind and near-Earth magnetic conditions. A coronal mass ejection seen leaving the Sun requires estimates of direction and speed. Spacecraft upstream of Earth can later measure the approaching solar wind and magnetic field, giving a shorter, more direct warning of conditions.
Models such as NOAA’s auroral products estimate where precipitation and visible aurora are likely. They do not know one observer’s cloud, moonlight, light pollution, horizon or visual sensitivity. Magnetic latitude matters more than ordinary latitude, and local timing matters.
An aurora forecast is therefore probabilistic at the sky level and conditional at the backyard level. Cloud forecasts and darkness must be combined separately. Never drive into dangerous weather, trespass or stop on roads for a display.
Auroral light is beautiful; geomagnetic storms are infrastructure events
The same space-weather disturbances can drive currents in the ionosphere and ground. They can affect radio propagation, satellite operations, navigation and long conductors such as power networks. Visible aurora is not a direct damage meter: effects depend on storm evolution, local geology, technology and operational mitigation.
NOAA’s geomagnetic scales communicate categories for specific effects, while operators use detailed measurements and procedures. A dramatic red sky does not authorize claims that a grid failure is imminent. Conversely, infrastructure impacts can occur without a spectacular view from a particular city.
For conditions right now rather than the mechanism behind them, go to an official space-weather service. Any specific forecast printed in an article like this one is stale by the time you read it.
Birkeland built a physical question from a sky full of stories
Long before modern plasma physics, cultures living under auroral skies developed names, teachings and interpretations. These are distinct knowledge traditions, not decorative quotations for a science hook. Any inclusion requires community-specific sourcing and review rather than blending “northern legends” into one invented voice.
In the late nineteenth and early twentieth centuries, Kristian Birkeland argued that charged particles and electric currents linked Sun, magnetic field and aurora. His laboratory terrella experiments directed electron beams toward magnetized spheres and produced polar glows. The setup was not a scale model of every magnetospheric process, but it made a remote celestial display experimentally arguable.
Spacecraft later measured field-aligned currents and plasma directly. Modern missions combine satellites, rockets, radar, cameras and ground magnetometers because no single vantage separates spatial structure from change over time.
One camera cannot tell whether the curtain moved or the particles changed
A ground imager records brightness along each line of sight. If an arc brightens, several physical stories can fit: more electrons arrived, their energy distribution changed, the emitting sheet moved into a longer viewing path, or atmospheric composition changed. A two-dimensional movie mixes space and time.
Researchers reduce that ambiguity with networks of cameras viewing the same volume from different positions, narrowband filters isolating emission lines, incoherent-scatter radar measuring ionospheric plasma, and satellites sampling particles above. Sounding rockets can cross an auroral structure with electric-field, particle and magnetic instruments, but their path is brief and local. A satellite may revisit slowly; a camera may be clouded; a radar samples a limited beam.
THEMIS was designed around this timing problem. Multiple spacecraft and ground imagers observed different parts of the magnetosphere–ionosphere system, helping test where substorm brightening sat relative to changes in the magnetotail. Even multi-point observations require models to connect regions separated by tens of thousands of kilometers.
That uncertainty is easy to lose sight of. A clean arrow running from one reconnection site in the magnetotail to one green arc overhead implies a certainty no single observation supplies. The sequence is a working synthesis assembled from many events, and the timing is not identical from one substorm to the next.
Brightness has a unit human vision did not invent
Auroral emissions are often reported in rayleighs, a unit of photon radiance integrated along a column. One rayleigh corresponds to 10^10 photons per square metre per second emitted into 4π steradians under the unit’s conventional definition. It is useful because a camera looks through a long luminous path rather than sampling one atom.
Suppose an illustrative narrowband measurement reports 10 kilorayleighs at 557.7 nm. That is 10,000 rayleighs: a substantial photon column rate, but it still does not state what a person sees. The eye integrates across wavelength and time, adapts to darkness and background light, and has no rayleigh readout. Cameras add aperture, exposure and sensor efficiency.
Scientists can combine calibrated brightness at several wavelengths to infer characteristic energy and energy flux of precipitating electrons, but the inference depends on atmospheric models and quenching. Clouds scatter city light and can mimic diffuse color. Moonlight changes contrast. Uncalibrated RGB values from a phone cannot be converted directly into electron energy.
Space weather is a chain of arrival-time uncertainties
A coronal mass ejection first has uncertain three-dimensional direction because coronagraph images project an expanding structure onto the sky. Models propagate it through a structured solar wind where faster and slower streams interact. An upstream spacecraft near the Sun–Earth line samples only one portion shortly before the disturbance reaches Earth.
The north–south component of the interplanetary magnetic field strongly affects dayside coupling, yet its orientation at Earth may not be known accurately days in advance. Once energy enters the magnetosphere, substorm timing and local precipitation add another layer. An auroral oval product is therefore updated as measurements move downstream.
This explains why a responsible forecast uses windows and probabilities. It also explains two apparent failures: a strong solar eruption may miss Earth, while modest upstream conditions can still produce locally attractive aurora under dark clear skies. Forecast skill must be scored against defined measurements, not against the best photograph posted anywhere inside a broad region.
A safe observation: let the spectrum correct the photograph
Use an archived NASA or NOAA aurora image with documented time and location. Compare visible colors with a calibrated spectral or altitude explanation. Note exposure details if available, then compare with observer reports. The goal is to identify what the sensor accumulated, not decide whether viewers were “wrong.”
For live viewing, use official forecasts, safe public locations and weather guidance. Never stare at the Sun while looking for the source of space weather.
The sky glows because an atom briefly survives its surroundings
Aurora begins with energy transfer across a changing magnetosphere. Accelerated particles follow and cross magnetic structures, precipitate into the upper atmosphere and collide with oxygen and nitrogen. Those atmospheric species store energy in allowed states, then either emit photons or lose the excitation through another collision.
Green oxygen succeeds where density, particle deposition and a roughly second-long wait align. Red oxygen survives higher up, where collisions are rarer. Nitrogen adds lower-altitude color. The folds record current systems and perspective; the camera records more time and color than a dark-adapted eye may report.
The northern lights are not solar paint. They are Earth’s atmosphere answering invisible energy with a spectrum—and each color says something about which atom had enough time to speak.
Frequently asked questions
Are auroras made of solar particles?
Incoming plasma supplies and perturbs energy, but the visible photons are emitted mainly by excited atmospheric oxygen and nitrogen.
Why is green most common?
The 557.7-nm oxygen transition is efficiently excited and emitted over a common auroral altitude range where quenching is not too strong.
Why is red aurora higher?
Its oxygen state is longer-lived and is easily collisionally quenched in denser lower air.
Can aurora happen in the south?
Yes. Aurora australis surrounds the southern magnetic region; northern and southern displays are related but not perfect mirrors.
Why does my phone see more color?
It can integrate light longer and process color differently, while human night vision relies strongly on color-poor rods.
Does aurora make sound?
Most emission occurs too high for ordinary sound to travel directly to the observer. Rare reported sounds remain a separate near-ground research question.
Can aurora harm people watching outside?
The light itself is not a ground-level radiation hazard. Travel, cold and weather are practical risks; geomagnetic storms can affect technology.
Where should I check a forecast?
Use NOAA Space Weather Prediction Center or the relevant national service, then separately check clouds, darkness and local safety.
Sources & further reading
This explainer was prepared through desk research using the sources below; established findings are distinguished from open questions in the text. See our editorial methodology.
- NASA Science, Auroras — solar-wind/magnetosphere overview, altitude and species/color ranges.
- NASA Science, The Atmosphere…After Dark! — excitation, atmospheric species and altitude.
- NOAA SWPC, Aurora — operational space-weather and auroral context.
- NOAA SWPC, Aurora Dashboard/OVATION — model-based probability and forecast boundary.
- NOAA SWPC, Geomagnetic Storms — infrastructure and scale context.
- NASA, THEMIS mission — substorms and multi-point magnetospheric observation.
- Encyclopaedia/primary historical context via Birkeland’s Norwegian Aurora Polaris Expedition; specialist historical review required before quotation.
- NOAA/NASA, Space Weather Prediction Center services — live-product boundary.
- NIST, Atomic Spectra Database — authoritative wavelengths and transition-probability data for the oxygen and nitrogen lines; the production diagram must preserve the queried species/state labels.
- Palmroth et al., “Lower-thermosphere–ionosphere quantities: current status of measuring techniques and models” (2021) — peer-reviewed measurement review identifying the 557.7-nm green and 630.0-nm red lines and their use in altitude-resolved optical inference.
- Bates, “Auroral sound” (1974) — peer-reviewed review establishing that audible auroral sound remained conjectural rather than a settled direct-propagation mechanism.
Spotted an error? We correct verified mistakes promptly — email contact@flashscience.org.
Continue exploring